
See 365 days of Amazon UK price history and track real deals

Amazon shows up to 365 days of price history on UK product pages through its built-in “price history” link, or via Alexa on request. Check that chart first, then save the item to a wishlist or dedicated tracker so you’re notified when it dips below its average. WantThis is one UK option that combines both steps in one place.
TL;DR:
- Amazon’s built-in price history shows up to 365 days of data, but may be incomplete for new listings, variants, or third-party sellers.
- Third-party tools can provide broader price tracking across multiple retailers and longer datasets, but may require extensive browser permissions.
- Price charts reveal key insights like historic lows, average prices, and recent volatility, helping identify genuine deals versus temporary spikes.
- UK price patterns typically include major drops during Black Friday, Prime Day, Boxing Day, and post-Christmas, especially in electronics and household goods.
- Regularly tracking prices with a wishlist or dedicated app reduces impulsive buying and helps confirm whether item discounts are truly worth acting on.
Table of Contents
- How to view Amazon’s price history on Amazon.co.uk and with Alexa
- Third-party trackers and apps: what UK shoppers actually need
- How to read a price history chart without getting fooled
- When prices typically drop in the UK
- A step-by-step workflow for tracking prices properly
- The privacy trade-offs of extensions and price trackers worth knowing
- Author perspective: using price history and wishlists for UK gift shopping
- Track prices and share your list with WantThis
- Sources
How to view Amazon’s price history on Amazon.co.uk and with Alexa
Amazon rolled out its own price history feature that lets UK shoppers see up to 365 days of pricing on eligible product pages. On desktop, look for the “price history” link sitting just below the price box, usually near the “Add to Basket” button. On the mobile app, it tends to appear slightly lower down the product page, under the buying options.
The chart typically lets you toggle between monthly, quarterly, and yearly views, so you can check whether today’s price genuinely beats recent prices such as last month or last Black Friday.
You can also ask Alexa directly. Saying something like “Alexa, what’s the price history for this?” while looking at a product, or asking Alexa for Shopping to pull up recent price trends, works on supported devices.
A few limits worth knowing before you rely on it:
- The feature is tied to a specific ASIN, so a colour or size variant of the same product may show separate, incomplete history.
- Prices sold by third-party marketplace sellers rather than Amazon itself don’t always carry the same depth of data.
- Not every product has 365 days of recorded history; newer listings will show a shorter window.
Amazon has said the goal of the feature is to build shopper confidence by making price context part of the normal browsing experience, rather than something you have to hunt for separately.
Third-party trackers and apps: what UK shoppers actually need
Amazon’s own chart is a good starting point, but it only covers Amazon. Three broad types of third-party tool fill the gaps.
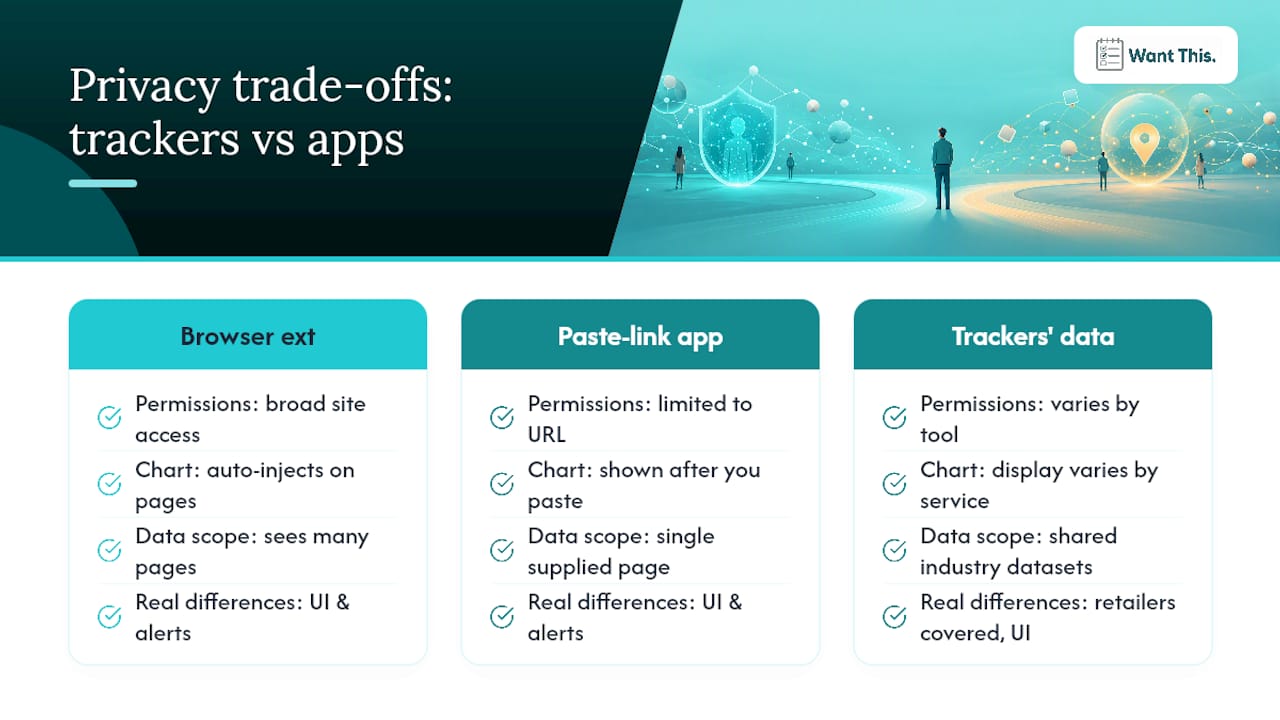
Browser extensions inject a price graph directly onto the product page as you browse, pulling from their own stored data. Paste-link apps work differently: you copy a product URL into the app and it builds a chart and alert without sitting inside your browser at all. Aggregator sites index thousands of ASINs and let you search or compare products across retailers rather than one at a time.
Many of these tools draw on long-running datasets. Some UK trackers rely on industry data going back to 2011, which is why the trend lines on different services often look remarkably similar even when the interfaces don’t.
Before picking one, weigh up:
- Whether it needs broad browser permissions or just a pasted link.
- How often it actually checks prices (some poll daily, others less often).
- Whether it stores and displays UK prices in GBP, or converts from a US-first dataset.
- Whether it only covers Amazon, or compares across UK retailers so you can see if Amazon is even the cheapest place to buy.
Pro Tip: If you’re wary of granting a browser extension access to everything you click, a paste-link app like Whisprice gives you most of the same tracking without the wider permissions.
How to read a price history chart without getting fooled
A chart is only useful if you know what you’re looking at. Four elements matter more than the headline number:
- Historical low and high show the absolute floor and ceiling the item has hit, useful for sanity-checking a “deal” claim.
- Rolling average (often 90-day) tells you what the product typically costs, which is usually a better benchmark than the all-time low.
- Recent volatility flags whether the price has been jumping around a lot, a sign the seller adjusts frequently rather than holding a stable price.
- Buy-box changes matter because the price you’re quoted can shift when a different seller wins the buy box, even if the listing itself hasn’t changed.
Practitioners tracking Amazon data have pointed out that “lowest ever” isn’t always the buying signal it appears to be.
Watch for the classic red flag: a price that spikes a week or two before a big sale, only to “drop” back to roughly where it always was. The chart exposes this instantly. If a £120 item suddenly reads £140 just before Black Friday, then reappears at £119 on the day, you haven’t actually been given a discount at all.
When prices typically drop in the UK
UK Amazon pricing follows a fairly predictable rhythm across the year, and category matters as much as the calendar.
- Black Friday and Cyber Monday (late November) bring the deepest one-off cuts, particularly on electronics.
- Prime Day (usually July) offers a second major dip, again skewed towards tech and home gadgets.
- Boxing Day sales often undercut even Black Friday on certain categories, especially toys and homeware left over from Christmas stock.
- January brings a slower, broader softening across most categories as retailers clear stock post-Christmas.
Electronics tend to see the steepest single-event discounts, while household goods and consumables show smaller but more frequent monthly dips rather than one big annual low. Books and toys often move in shorter, less predictable cycles tied to publisher promotions or seasonal stock clearance; learn more about the step-by-step book purchasing process to navigate these variations effectively.
As a rule of thumb, treat prices close to the recent average as fair, and significantly lower prices as genuinely worth acting on.
A step-by-step workflow for tracking prices properly
Checking a chart once isn’t tracking. A proper routine looks like this:
- Find the product’s ASIN or product URL on Amazon.
- Check Amazon’s built-in price history to see the 30, 90 and 365-day trend.
- Save the item to a wishlist or dedicated tracker rather than relying on memory.
- Set a target price based on the rolling average, not the all-time low.
- Choose how you want to be told: push notification, email, or both.
Organising by occasion helps too. A Christmas list kept separate from birthday saves means you’re not scrolling through unrelated items when a relative asks what to buy. WantThis lets you build lists this way and share them with friends or family, who can quietly mark something as reserved so nobody buys the same gift twice.
Pro Tip: If you’d rather not install a browser extension, use a paste-link tool instead. It does the same job with far fewer permissions requested.
The privacy trade-offs of extensions and price trackers worth knowing
Browser extensions that inject price charts directly onto Amazon pages typically need broad permissions: the ability to read and change data on every site you visit, not just Amazon. That’s the trade-off for convenience. Many trackers request this level of access so the chart can appear automatically without you doing anything, but it means the extension can technically see far more of your browsing than the single product page you’re checking.
Paste-link apps sidestep this by only ever looking at the specific URL you give them, which is worth considering if you’re uneasy about a tool sitting in your browser permanently.
There’s also a data-depth question. Because several trackers pull from the same underlying industry datasets, one service doesn’t necessarily have “better” raw numbers than another. The real differences are in interface, notification style, and which retailers beyond Amazon they cover. Choose based on how the tool fits your habits, not an assumption that one has secretly superior data.
Finally, remember that any price history tool, native or third-party, only shows you what’s already happened. It can’t guarantee a future drop, and a low historical price is no promise the item will ever return to it.
Author perspective: using price history and wishlists for UK gift shopping
I built a Christmas wishlist in October one year and watched a speaker set drift up £15 before settling back down in November, exactly the pre-sale spike pattern worth recognising. Having that history stopped me buying early out of panic…
— Stuart
Track prices and share your list with WantThis
WantThis gives you a faster way to act on everything covered above: paste a product link from Amazon or any other UK retailer, and it pulls in the title, image and current price automatically, then tracks that price over time for you.
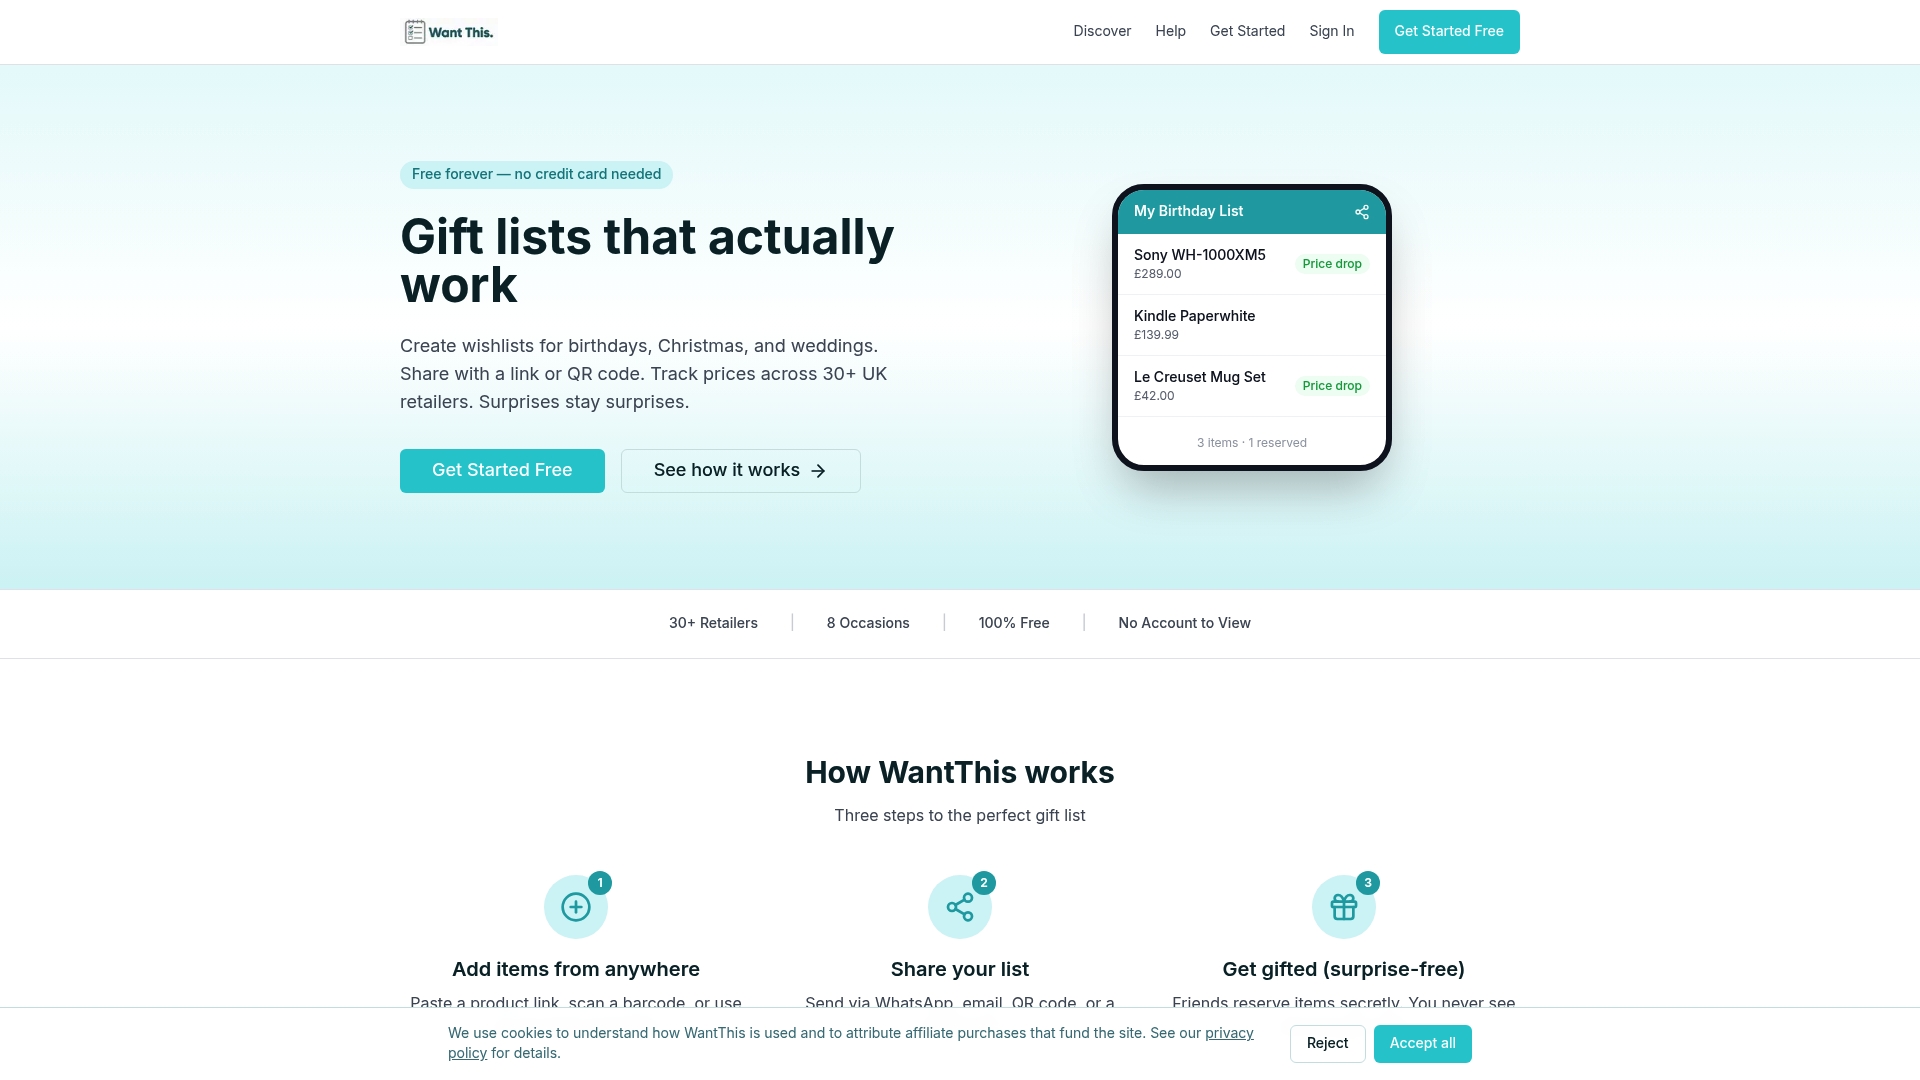
Lists can be organised by occasion so that different gift ideas stay separate rather than tangled together. Prices are shown in GBP, and users can choose whether alerts come by push notification or email when a saved item drops. Because lists can be shared privately, friends and family can reserve an item without spoiling the surprise or risking a duplicate gift.
If you’re already tracking a handful of products across different sites, start by pasting one link into a new WantThis list and setting a target price. It takes less time than checking five separate browser tabs.
Sources
- You can now check a product’s price history spanning a whole year on Amazon
- How to check Amazon price history
- Amazon tests native price tracking
- idealo – Your Price Comparison